-
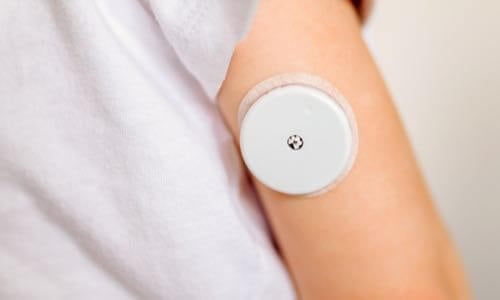
Glucose Monitoring
Glucose Meters (BGM) & Monitoring

-
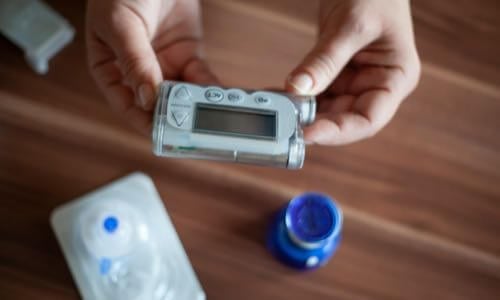
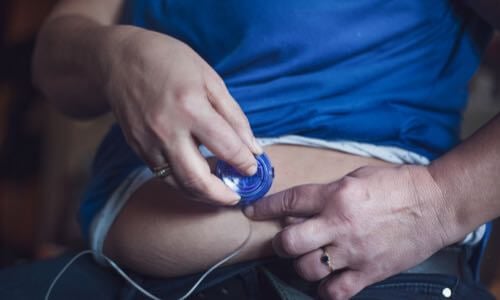
Insulin Pumps & AID
Find & Compare Insulin Pumps
View current insulin pumps from a variety of manufacturers. Compare features and technical specifications and find training resources, affordability information, prescription details and more.
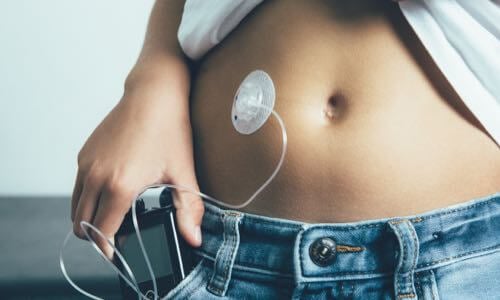
Find Infusion Sets
View features and specifications of popular infusion sets to determine the best option for your patients and clients.
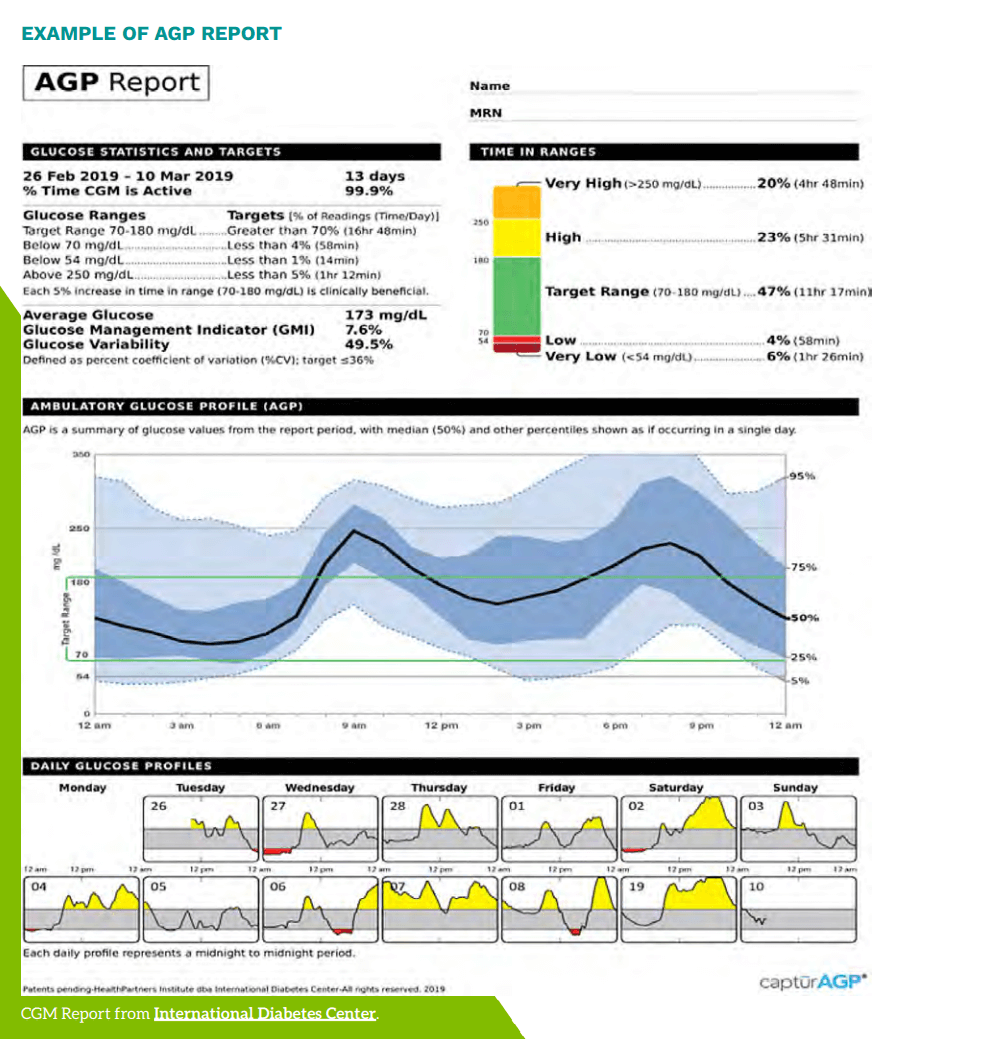
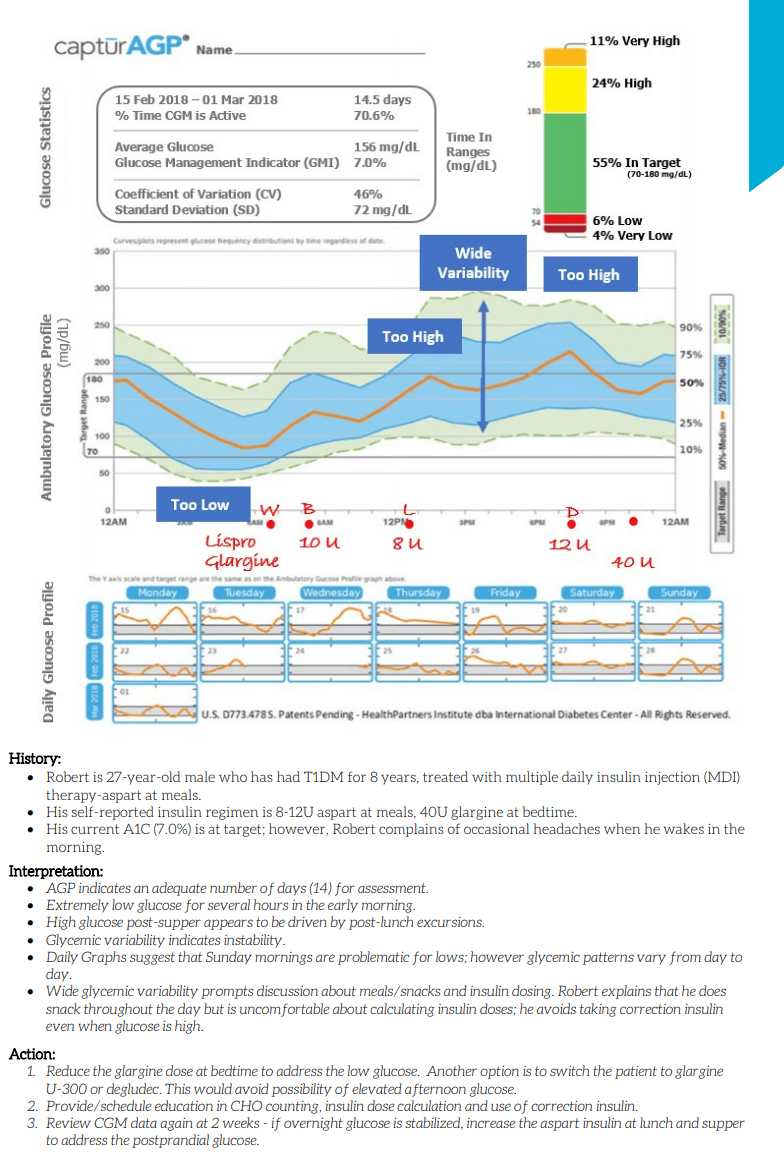
 Guidance on clinical assessment, adjustments, report interpretation and key education. Designed to be used during clinic visits.
-(3).jpg?sfvrsn=16486d59_5)
-
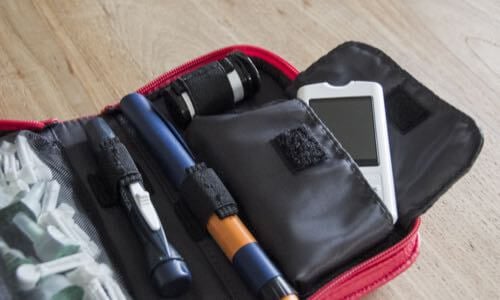
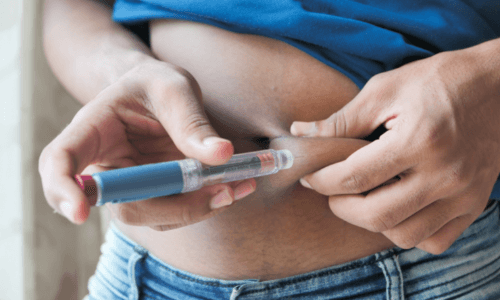
Medicine Delivery
Find & Compare Delivery Devices
View and compare features and technical specifications for current traditional pens, connected pens, inhaled options and patches for insulins, glucagon and other medicines to help manage diabetes.
 Proper basal insulin initiation and titration can help reduce therapeutic inertia and engage patients in their diabetes management. Find videos, podcasts and other resources to fine tune your knowledge.
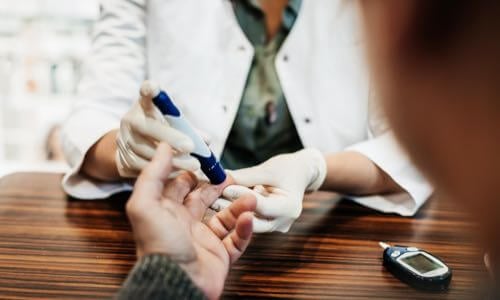
-
Apps & Platforms
Find Apps & Platforms
Find a sample of the latest online apps and digital platforms designed to prevent, manage and/or treat diabetes. We highlight apps and DTx for people with diabetes as well as the professionals treating them.
 An overview of Glycemic Management Platforms that answers key questions including: What are they? What to consider? How can my inpatient facility benefit and more.
 -
Educational Resources
Online Learning
Find diabetes certificate programs, online learning opportunities, webinars, device training, practical tools and more. All resources are developed for diabetes healthcare professionals by diabetes healthcare professionals.

Podcasts & Videos
Find a variety of podcasts and videos focused on the latest topics in diabetes technology specifically created for diabetes healthcare professionals.
New! Professional Competencies for Technology Use
Learn about the diabetes technology competencies that are essential for all levels of the care team and support staff in various care settings to deliver comprehensive diabetes management and support to person living with diabetes.

Diabetes Device Training
Danatech device trainings introduce healthcare professionals to the latest diabetes technology including the newest CGMs, automated insulin delivery devices, smart pens and more. Trainings include overviews, training specifics, FAQs and more.
 Certificate programs, webinars and courses related to cardiometabolic health and diabetes. Topics include weight loss, treatments, lifestyle enhancements, the latest technological advancements and more.
 Find danatech's interactive diabetes technology tools for point-of-care, insurance coverage and more.